
Predict and prevent potential bottlenecks, downtime, and performance degradation
Explorer monitoring is a managed service that simplifies server monitoring and observability of your infrastructure. It gives system administrators insight into overall infrastructure health and performance, it simplifies performance bottlenecks and service outages detection for DevOps teams, and it provides project managers with alerts before SLAsⓘ or SLO’sⓘ.
Choose the perfect server monitoring plan for your business needs
Explorer SMALLMost Affordable€35
2 monitored servers ⓘ
1 month data retention
1 Admin hour included ⓘ
Built-in dashboards ⓘ
x
x
Get StartedExplorer LARGEBest Value€75
20 monitored servers ⓘ
3 month data retention
1 Admin hour included ⓘ
Built-in dashboards ⓘ
Custom dashboards ⓘ
Alerting ⓘ
Get StartedExplorer XLARGEMost Features€140
40 monitored servers ⓘ
6 month data retention
2 Admin hour included ⓘ
Built-in dashboards ⓘ
Custom dashboards ⓘ
Alerting ⓘ
Get StartedExplorer DevOps monitoring features
Open source from the ground up
- Explore our robust server monitoring service, powered by reliable open-source components tailor-made for your needs.
- Collect metrics with ease using Telegraf – a lightweight, extensible monitoring agent.
- Rely on InfluxDB for secure and accessible storage of your high-performance time-series data.
- Visualize your metrics effortlessly with Grafana’s intuitive interface.
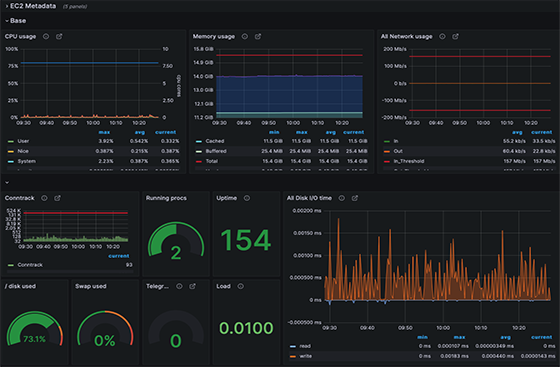
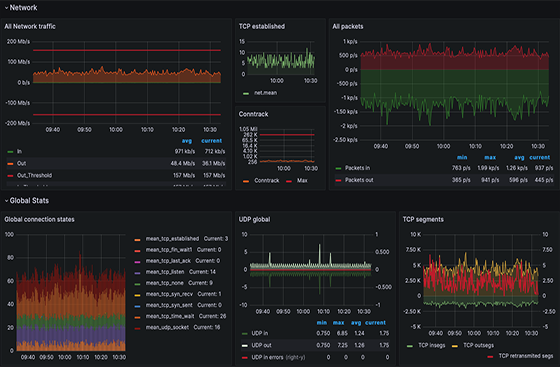
High-level infrastructure overview
- Quickly grasp your server or Kubernetes cluster’s health with our predefined, high-level dashboards.
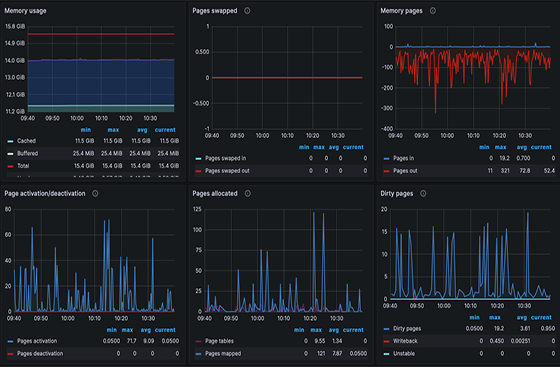
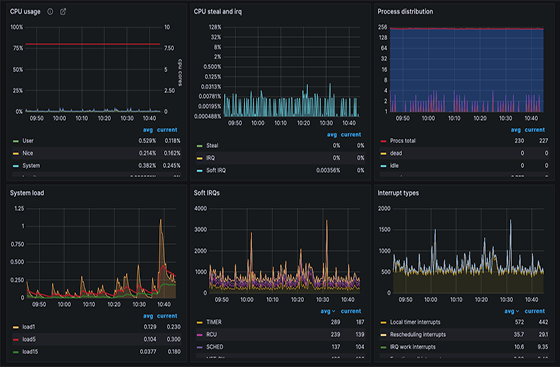
- Dive deeper with our custom system dashboards, covering everything from CPU, memory, disk, and network performance to Linux kernel details.
- Monitor system performance trends to anticipate potential issues.
- Empower your team with actionable insights for a more efficient infrastructure.
Service dashboards
- Leverage our predefined dashboards to swiftly identify issues, anomalies, and their root causes.
- Covering a diverse range of services, from Docker, MySQL, PostgreSQL, to Redis, Varnish, HAProxy, Nginx, Apache, PHP-FPM, Elasticsearch, RabbitMQ, and beyond.
- Stay ahead with real-time Docker container resource usage stats and more.
- Quickly customize dashboards to focus on what matters to your business.
Alerts
- Set up custom alerts with ease on a user-friendly Grafana web interface.
- Receive instant notifications across more than 20 channels including Slack, Teams, Email, SMS, Discord, and Google Hangouts Chat.
- Stay ahead with alerts when predefined thresholds are crossed or specific conditions are met.
- Turn alerts into actionable insights for efficient responses, keeping your infrastructure on track.
Explorer server monitoring setup process
Info Call
Developing monitoring strategy
Monitoring setup
* We do not gather any customer-related data, codebase, or user-uploaded materials, and the data we gather is anonymized and it will not leave the EU territory.
Our other services
Latest blog posts

AWS Cost Explorer – analyzing your costs and usage
Are you struggling to keep track and optimize your AWS cost? Looking for a simple way to gain control of... read more
The Manifest Crowns Sysbee as one of the Most-Reviewed IT Services Providers in Croatia
Many companies struggle with their day-to-day processes and operations due to a lack of understanding of IT services, IT solutions... read more
What is Amazon EC2 and how does it work
Trying to find a flexible and scalable solution to meet your computing needs? Amazon EC2, Elastic Compute Cloud, is the... read more
What is AWS IAM (Identity and Access Management)
With AWS IAM, you can control access to ensure only authorized users can use your resources. IAM gives you control... read more
Simulogics | Migrating key services to AWS
Migrating key services to AWS for improved stability and scalability, in addition to improved backup system, disaster recovery, and reduction... read more
The Role of Server Backup for Businesses
Data security is priceless, and businesses rely heavily on their data to operate efficiently and effectively. However, with the increasing... read more
AWS Cost Optimization
Are you tired of seeing your company's budget being eaten up by sky-high AWS costs? Whether you're a scrappy startup... read more
Understanding the Importance of GDPR in the IT Sector
Are you curious about the buzzword that has been attracting attention across IT sector - GDPR? Contrary to a bunch... read more
Bare metal disaster recovery with Bareos
Bare metal recovery, sometimes called bare metal restore, is a backup restoration method that allows sysadmins to restore a server... read more