Monitoring origins: Where it all began
Today’s monitoring systems have many features to help you get all of the data you need. However, it wasn’t always like that; tools were limited, offered no metrics and were hard to deploy and maintain.
In this post, we’ll take a look at the history of monitoring tools. With almost 20 years of experience in the hosting industry, we went through many different setups, giving us a unique opportunity to evaluate tools as they became available. But first, let’s discuss why we need monitoring.
Why do we need monitoring
Monitoring is a vital component of any infrastructure setup. As we discussed previously, monitoring plays an integral role when you wish to ensure that your system works smoothly and efficiently.
There are two main reasons why we use monitoring in our business:
To resolve issues before they arise
By monitoring the status of our services, we can see problems as soon as they occur. With a sound monitoring system, our engineers can react faster and fix problems instantly, before our customers even notice them.
To see patterns and anticipate potential issues
By analyzing data collected by our monitoring system, we can spot trends and anticipate potential issues. With such an approach, we can provide our customers with proactive support, instead of acting reactively.
A good monitoring system needs to answer the following questions:
- Does it work? (basic ping or uptime test)
- How does it work? (collecting performance metrics)
- What’s the trend? (what was happening / predictions)
Additionally, monitoring shouldn’t affect your system’s normal operations, and should also be able to send out alarms if something is amiss.
Now that we’ve established why we needed monitoring, to begin with, and what a good monitoring system is, we can go down the memory lane and discuss all of the different tools our engineers tried out before coming up with our current monitoring setup.
Monitoring beginnings – 1999 to 2006
We consider RRDtool to be the first cornerstone in server-side monitoring. Although there are tools which officially started with their development much earlier (e.g. Nagios in 1996), the timeline we set up is by project popularity.
The RRD tool has evolved as a by-product of the MRTG or Multi Router Traffic Grapher. MRTG extracted data via SNMP primarily from network equipment, but it could also be configured to graph server metrics exposed via MIBs such as CPU usage, memory usage, etc. In practice, most people used it to monitor network equipment and server load.
After that comes Cacti, a project aimed at creating an interface which will be more user friendly compared to MRTG. Since Cacti inherited MRTG, its primary focus was collecting information through SNMP.
2006 – GIGRIB and Nagios
The year is 2006, and the first public monitoring system called GIGRIB (today’s Pingdom) becomes available to the public eye.
The idea behind GIGRIB was fantastic, as it distributed ping and HTTP status monitoring of target hosts. There was a free version available, which allowed monitoring up to 10 hosts provided that the p2p distributed monitoring tool is downloaded and launched (sort of like a SETI@home just for uptime monitoring).
We are still in 2006, and Nagios is starting to gain popularity.
Nagios brought a real hype in the monitoring world, something like Kubernetes does today, and of course, we had to dig a bit deeper into this monitoring system.
After a couple of tests performed we’ve confirmed that:
- Service uptime checks – work
- Metrics – sort of collected
- Trends – followed
- Alarms – available
And with that, we were saved – Nagios was the way to go and we had a platform ready for our new production monitoring system.

What we’ve learned over the years by using Nagios:
- It has the best performance compared to similar products.
- It has an extensive community, accompanied by a lot of extensions and service check plugins.
- It’s quite complex – the initial setup took a good two months, and we had to reconfigure it from scratch at least three to four times, every couple of months.
- The updates (at the time) were not an easy task
- Scalability, and High Availability, although it exists in theory, is terribly complicated and quite easy to mess up. We do not recommend beginners to tackle this task.
Nonetheless, we do recommend giving Nagios or some of its derivatives a shot, even today.
Missing Metrics
Nagios is an excellent tool for detecting the current status; however, Nagios lacks one key component – metrics. Without metrics, we have no insight into machine performance while the machine is working as expected.
The typical workflow with Nagios is:
- Don’t touch anything while it’s working ok
- When it stops working, Nagios will let you know
- You log in and check what’s happening
But what happens when the notification arrives too late, and the only option is to reboot the system? What was happening on the system until that point? That’s why we need metrics.
2007 – Munin
With that in mind, we started using Munin. The Munin projects first public release was back in 2003, with very active development up to 2005. The project shows signs of some development efforts even today, as quite a lot of people are still using it.
We started using Munin sometime during 2007 as on-site monitoring. Munin is a tool which is clearly server-oriented; it contains a large number of plugins for various server-side services and is relatively easy to set up.
Even though Munin was a great tool at the time, it comes with its own set of problems we encountered during our day-to-day use:
- The manual deployment of Munin and desired plugins is laborious.
- Munin used to be pretty resource hungry when generating graphs
- If the host is down, we have no idea why it went down until we recovered it.
- Certain plugins have been known to trigger bugs and additional resource usage.
- A particularly annoying “feature” was that by default it had no central place to view graphs from all hosts
- Even when you overcome the previous issue, Disk IO becomes a massive problem after 200+ hosts are loaded onto the central Munin
To tackle these issues, we were still looking for a better solution, and in 2013 we found Ganglia.
2013 – Ganglia
Ganglia is a scalable, distributed monitoring tool for high-performance computing systems, clusters and networks. The software is used to view either live or recorded statistics covering metrics such as CPU load averages or network utilization for many nodes.
Ganglia was used by Wikimedia at the time and was initially designed as a monitoring system for HPC clusters in universities. Ganglia comes with a broad set of default metrics (350 to 650 metrics per host), it’s easy to scale, and by default, everything is centralized. Additionally, Ganglia has an easy to use web interface.
How Ganglia works

By default, all gmond processes (agents) talk to each other in multicast. So each host in the cluster is aware of the other and has information about its performance.
It can also be configured in Unicast mode, which proved to be a rather good fit for our environment. In this setup, one or more gmond processes (aggregators) are aware of all hosts, and others know only about their own metrics.
An aggregator collects information for its cluster in our case the datacenter or logical entity of a client cluster.
Gmeta is another process on a centralized host that stores RRDs and collects metrics from primary or failover gmond aggregators.
If necessary, the client can have his own gmeta collector and web interface, and forward all the information to our central interface. The web interface is a simple LAMP stack application.
Ganglia’s web interface
Ganglia’s web interface shows us the entire GRID, which consists of one or more clusters.
The interface supports search and has the ability to create custom views (dashboards). We can easily generate graph aggregates, compare hosts, see trends (e.g. when a server runs out of disk) and add annotations to graphs.
The cluster heatmap is a nice touch but is of little use if the cluster is not load balanced.
The timeshift option shown in the graph below was a total killer feature for us, as it provided an instant view to compare server behavior against the same interval in the past.
Challenges with Metric systems so far
We used Munin which writes to RRDs, and even with smaller sets of metrics we already experienced disk IO issues. Using Ganglia was just like adding fuel to the fire.
The problem lies in a large number of tiny writes. Each data point must read a 1k header, write 1k into it and write an additional 1k as a metric point. Because of the 4k block level, we end up with 12k writes, or 9k wasted IOs.
Fortunately, the Ganglia integrates very well with RRDcached, which aggregates a good deal of data and writes to disk so that they become manageable.
Like Munin, Ganglia also suffers from various bugs in plugins which can block the entire gmond, resulting in missing metrics. That brings us to the challenge of meta monitoring, or how to monitor problems with missing metrics.
We had to standardize many things that weren’t related to monitoring, which turned out to be a great thing as it made us work out some things that would otherwise never have come to our attention.
And finally, the fact remains that Ganglia’s dashboard is old-ish, and we needed something more advanced and modern.
Why not Graphite?
Good question. At one point, we had the perfect opportunity to try it out.
- Graphite comes by default with Grafana support
- Drop-in replacement, gmeta can already push into its carbon storage.
- It’s supposed to be scalable as is used by big companies.
- However, by testing it, the performance proved to be disastrous
In a situation where we had a new server with a better disk subsystem to replace our current Ganglia host, we did a little experiment.
On the original Gmeta collector, we started pushing one copy of all collected metrics to Graphite on a new server. The same set of metrics, same time interval. Graphite spasms in the throes of disk IO. Carbon written in Python just can’t keep up with RRD.
One option would be to buy more monitoring servers, but that’s not the direction in which any company wants to go.
All is not lost, Graphite web interface still supports reading metrics from RRD, and can be easily connected to Ganglia’s RRD store to act as a proxy for Grafana.
The three G’s setup
Using the best from all the available tools at the time we consolidated our monitoring infrastructure around Ganglia, Graphite and Grafana.
Since Ganglia is already collecting information very efficiently, it made no sense to perform double service checks through Nagios, so we wrote an internal integration set of scripts called gnag.
The idea behind this was to use Nagios as a service alert dashboard only. And offload all the metrics and availability checking to Ganglia. In this scenario, Nagios can use gnag to gather large sets of metrics in batches from gmond processes quickly and efficiently.
At the same time, Nagios and gnag were able to check for stale metrics, this way detecting any metric that isn’t collecting data in predefined intervals.
Ganglia RRD storage then serves as a backend for the Graphite’s Django web app, acting as metrics datastore for Grafana web interface.

In the end, to automate everything we have created a set of internal Puppet modules for service auto-discovery, automatic monitoring probes provisioning and configuration.
This meant our Sysadmins no longer need to worry about manually deploying monitoring configuration. It all happens automatically in the background.
Although it might sound complicated, with lots of moving parts, the system was designed with several fail-safes, and it has been in production with no issues for over 7 years.
Grafana dashboards
What is Grafana?
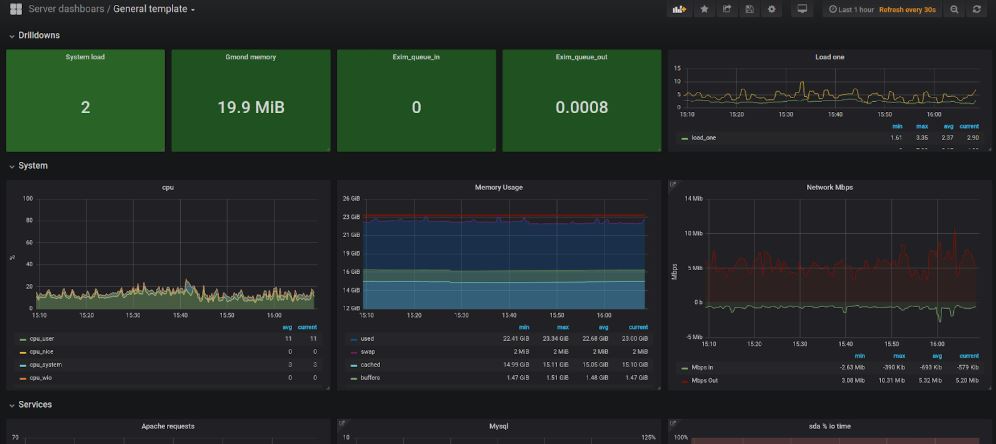
Grafana is a web-based metrics visualisation software that supports creating custom dashboards of metrics from multiple sources.
With much experience using Grafana in production, we came up with a set of predefined and templated dashboards which give us an insight into the most important system operations.
This setup has helped us greatly with every problem report and alarm triggered.

Affordable metrics
Even though there are many plugins available in the default Ganglia plugin library, inevitably you will run into a situation where you need to monitor additional things on the system.
Ganglia allows third party plugin development that is feature-rich and offers more flexibility at the price of development complexity.
At the same time, you can use an integrated gmetric binary to push new metrics into the system from cli.
So, for example, the following simple bash script triggered by a cron job can inject custom metrics for whatever requirement we have, in this case, the status of Exim queue.
#!/bin/bash
GMETRIC="/usr/bin/gmetric -c /etc/ganglia/gmond.conf"
EXPIRE=300

incoming=$(/usr/sbin/exim -bpc)

#Incoming queue
$GMETRIC -g exim -t int8 -n "Exim_incoming" -v $incoming -x ${EXPIRE} -d ${EXPIRE}
Conclusion
Even though monitoring systems evolved quite a bit from the early days of MRTG and total system information darkness, this story is far from over. Stay tuned for our next article, and see how monitoring systems have evolved in the TSDB era. In the meantime, if you have any questions or comments regarding this topic, feel free to leave them below or get in touch with our experts.


